Guide · Revenue attribution
What a Revenue Analytics Dashboard Should Show (With Examples)
The eight things a revenue analytics dashboard needs for a small online business, with real examples, and the vanity charts you can leave out.
· 3 min read

A revenue analytics dashboard answers one question quickly: is the business growing, and which marketing is responsible? Many dashboards bury that under dozens of charts. Here is what a good one shows, using screenshots from DataFair's demo (sample data).
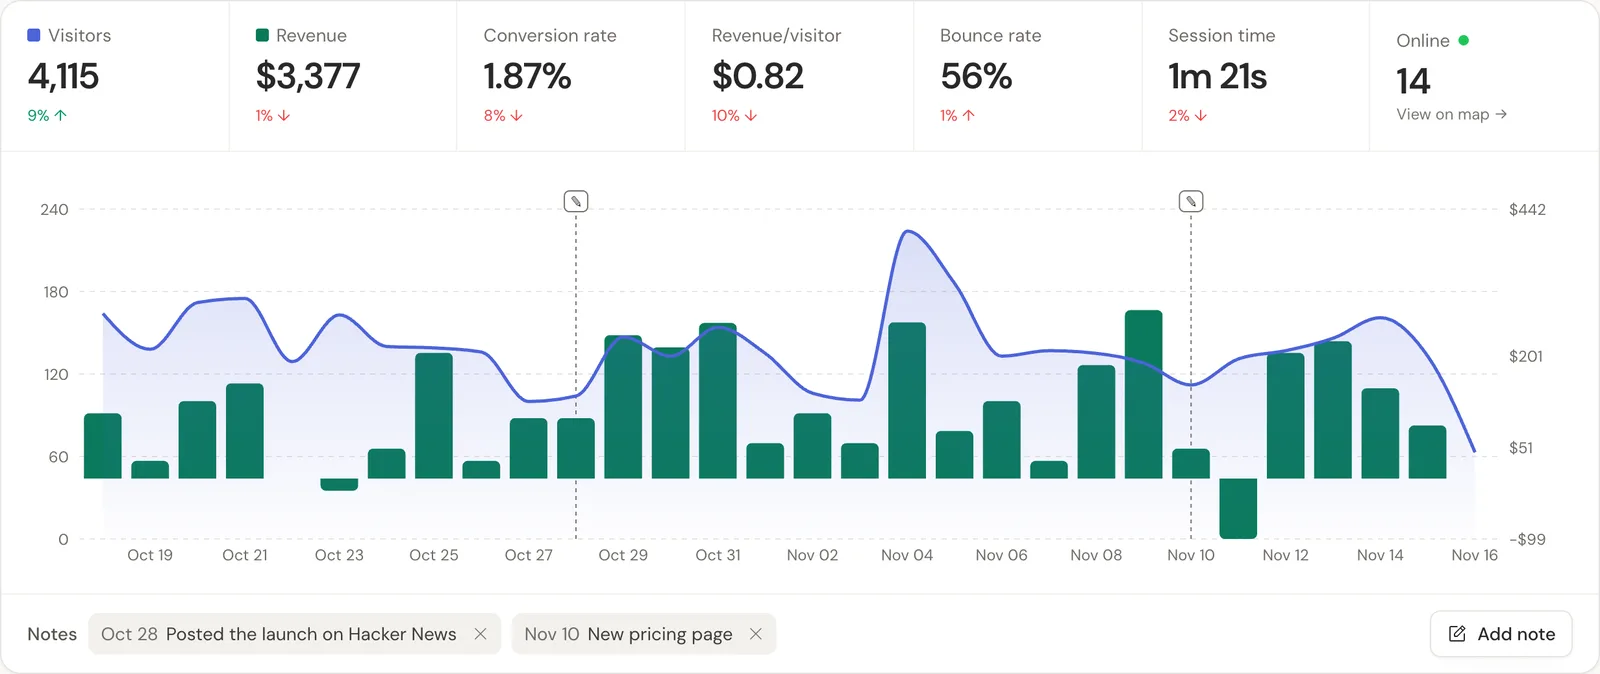
1. Visitors and revenue on one chart
Two lines, one time axis. When revenue moves without visitors, something changed in conversion or pricing. When visitors spike without revenue, a channel brought the wrong people.
2. The headline numbers
Visitors, revenue, conversion rate and revenue per visitor for the period, each with the change from the previous one. Revenue per visitor is the number to watch most.
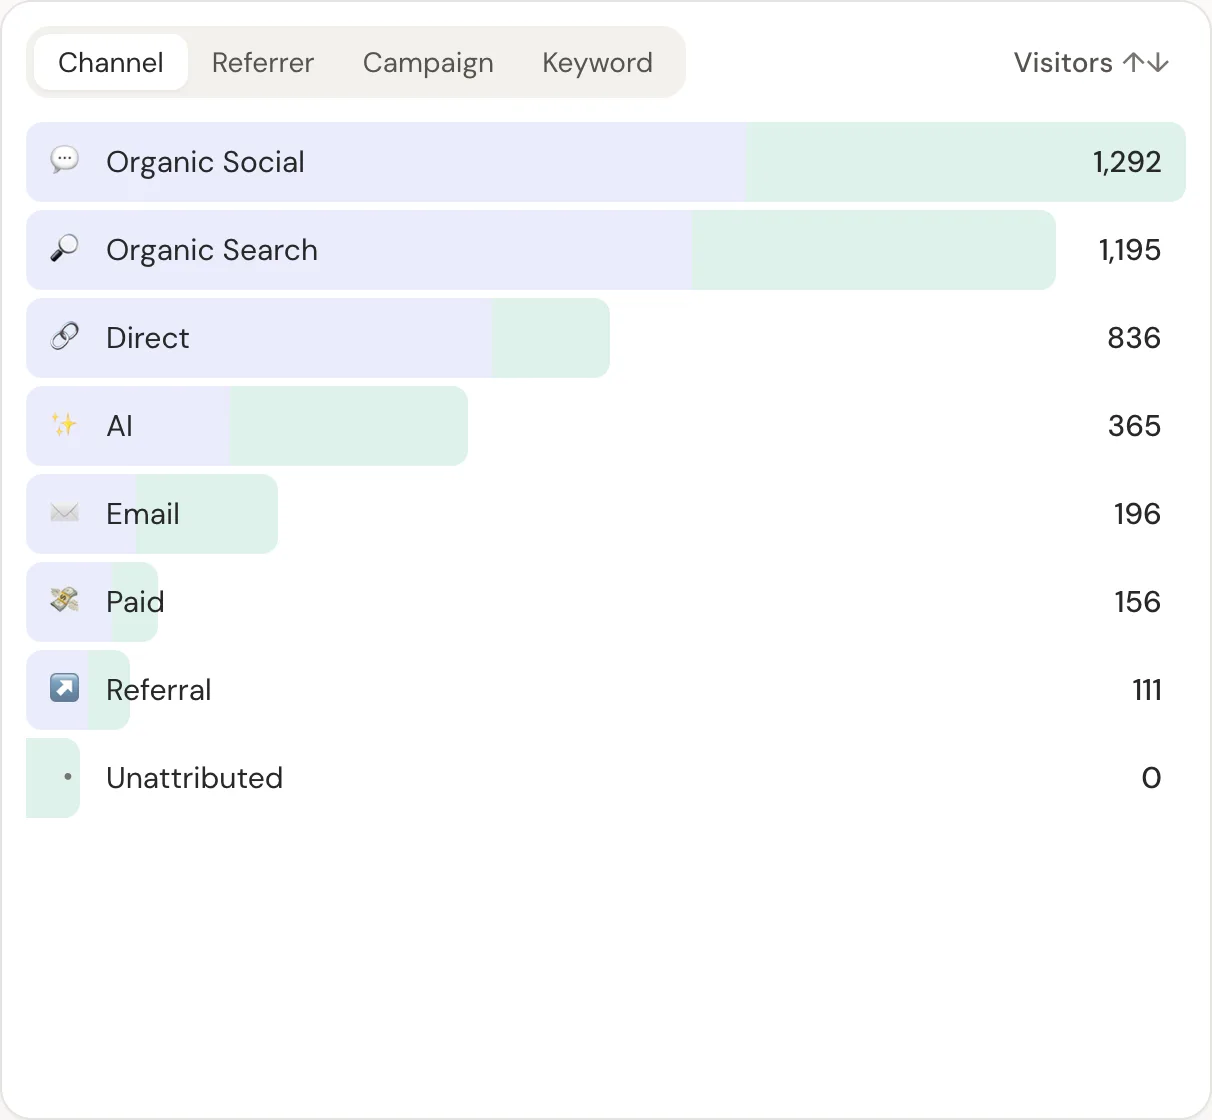
3. Revenue by channel and source
Channels (search, social, email, AI) for strategy, sources (Google, a newsletter, ChatGPT) for tactics, and campaigns for anything you tagged.
4. Revenue by landing page
Which pages bring buyers. For content businesses this is the most actionable report. Which blog posts make money.
5. Revenue by country
Where customers are, not just visitors. How to read it.
6. Recurring revenue by source
For subscriptions: MRR, new subscribers and churn by the source each customer came from. MRR by acquisition channel.
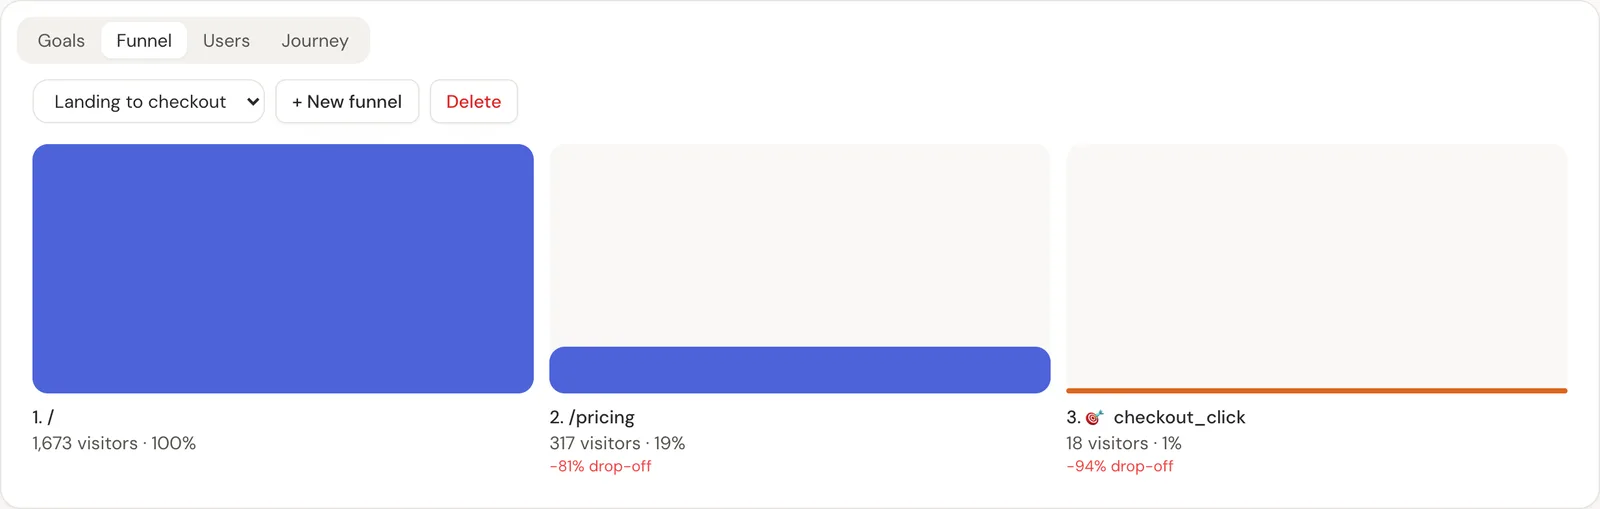
7. Goals and funnels
Signups, trial starts, checkout clicks, and the steps between them.
8. Notes on the chart
Mark launches, posts and price changes. Six weeks later, nobody remembers why the line jumped.
What to leave out
- Average session duration as a headline. It's noisy and rarely changes a decision.
- Pageviews per visit, unless you sell ads.
- Ten charts of the same data. One filter that applies to everything beats a wall of charts.
Build or buy?
You can build this in a BI tool from your payment provider's exports and analytics data. The hard part isn't the charts, it's the join between payments and visits, and keeping refunds and renewals right. DataFair does that join from webhooks and shows all eight on one page, with filters that apply across reports. Explore it in the live demo.
Related guide: Revenue analytics: measure what pays, not just what visits.
Questions
- What is a revenue analytics dashboard?
- A dashboard that puts revenue next to traffic, by channel, source, page and country, so you can see which marketing brings paying customers.
- What KPIs should a revenue dashboard include?
- Visitors, revenue, conversion rate and revenue per visitor as headlines, then revenue by channel, landing page and country, plus recurring revenue and churn for subscriptions.
- Can I share a revenue dashboard with my team or investors?
- In DataFair, a public share link creates a read-only dashboard, and you can hide revenue on it if you prefer.