Guide · Traffic analytics
The 7 Website Analytics KPIs That Matter for a Small Business
Skip the vanity metrics. The seven website KPIs a small business should check weekly, how to calculate each, and what to do when they move.
· 3 min read
Analytics tools offer hundreds of metrics. A small business needs about seven. Check these weekly and you'll catch almost everything that matters.
1. Visitors
Unique people in the period. The size of your audience. Watch the trend, not the day.
2. Revenue
What you earned, from your payment provider, not from a browser pixel that misses blocked visitors and off-site checkouts.
3. Conversion rate
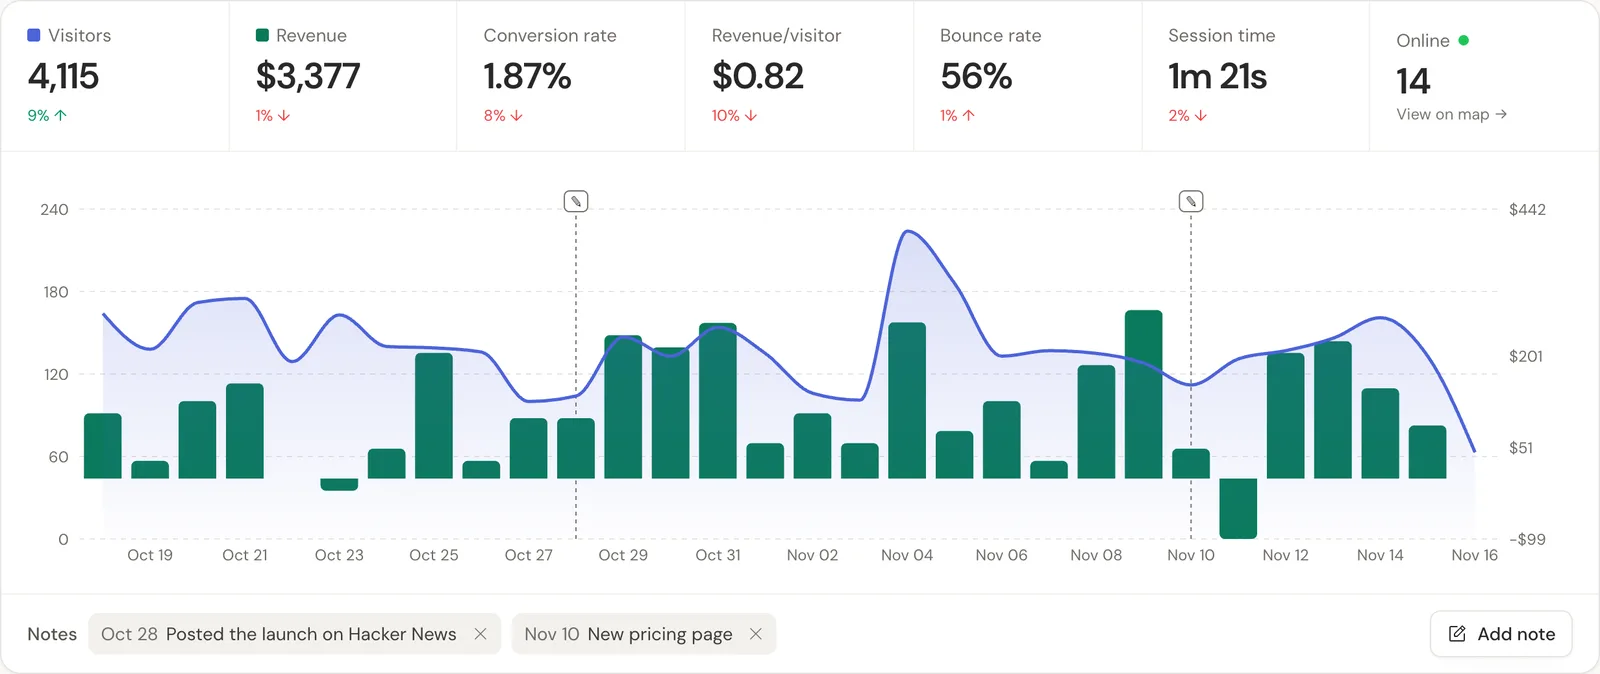
Conversion rate = Customers (or signups) ÷ Visitors
Example: 77 customers from 4,115 visitors = 1.87%
Define the conversion once (a purchase, a signup, a trial) and keep it fixed so the trend means something.
4. Revenue per visitor
Revenue per visitor = Revenue ÷ Visitors
Example: $3,377 ÷ 4,115 visitors = $0.82
The best single number for traffic quality, because it combines conversion and order value. The full guide.
5. Revenue by channel
Which sources bring paying customers. Sort by revenue, then compare revenue per visitor. This is where marketing decisions come from. Find your best channel.
6. Top landing pages by revenue
Which pages bring buyers. For content-driven businesses, the most actionable report there is.
7. Recurring revenue and churn (subscriptions)
MRR, new subscribers and churn, ideally by acquisition source, so you see which channels bring customers who stay.
Metrics you can mostly ignore
- Pageviews, unless you sell advertising
- Average session duration, noisy and easy to misread
- Bounce rate as a headline. It's useful when diagnosing a specific landing page, not as a weekly KPI
- Social followers, which say little about revenue
A weekly ten-minute routine
- Check visitors, revenue and revenue per visitor against last week.
- Look at the top three channels by revenue. Anything new?
- Check the top landing pages by revenue. Any page rising or falling?
- Add a chart note for anything you launched, so future you knows why a line moved.
In DataFair, the first four KPIs are the headline numbers on the dashboard, and the rest are one scroll away. Example screens in what a revenue dashboard should show.
Related guide: Revenue analytics: measure what pays, not just what visits.
Questions
- What are the most important website KPIs?
- For a business: visitors, revenue, conversion rate, revenue per visitor, revenue by channel and top landing pages by revenue. Add recurring revenue and churn for subscriptions.
- Is bounce rate a good KPI?
- Not as a weekly headline. It's useful for diagnosing specific landing pages.
- How often should I check website KPIs?
- Weekly for trends, monthly for channel decisions. Daily checks mostly show noise.